A lower average satisfaction score is a symptom, not a diagnosis. To find out whether it comes from one office, one team or one customer group, filter the same responses by each Jira field in turn, compare the segment with the overall result, and then read the comments and linked requests behind the numbers.
There are two practical routes. Atlassian documents a JQL search with CSV export and analysis in a spreadsheet. AdaptiveSurvey, which Kinline develops, lets you filter the feedback Dashboard by supported Jira fields without leaving the app. This guide walks through the routine and shows where each route fits.
The short answer: filter to the segment, compare it with the whole, then read the comments
- Fix the question and the date range you are comparing.
- Filter to one segment, such as a location, country, team or customer type, and note the score and the number of responses.
- Compare with the unfiltered view, or with everything except that segment.
- Read the comments and open the linked tickets for the segments that stand out.
- Export the matching rows if the review needs them outside Jira.
Filters show where low scores cluster. They do not show why. A London segment with a low communication score is a lead for reading tickets, not proof that London caused the drop.
Pick the question and period first
Segment comparisons are only meaningful if the period and the question match. Compare two periods of the same length, and check the response count beside every score. A segment with a handful of responses can swing an average far more than a large one.
If your form asks separate rating questions, decide which one you are investigating. A manager asking “is communication worse in one office?” should look at communication rather than the blended score.
The Dashboard offers two ways to isolate a question, and they behave differently:
- Score metric picker. It switches the Satisfaction Trend and Score Distribution card between the overall score and one question. It changes only that card.
- Question filter. Under Add filter → Question, it re-scores each response as the average of the questions you select and drops responses that answered none of them. Responses, response rate, headline score, trend, distribution, Question Scores and the response list all follow the selection. While it is applied, the picker is disabled.
The Question filter appears only when Question ratings is the active form and has more than one question. With a single overall rating form, segment the overall score instead. See the Filters documentation for the details.
The native route: JQL and CSV export
Atlassian’s knowledge base says the standard Jira Service Management Customer Satisfaction report aggregates results and limits filtering, which makes it hard to isolate segments by project, request type, time window, agent or organization. Its recommended workaround for a Jira CSAT report by segment has three steps:
- Write JQL in the Issue Navigator that matches the issues you want to evaluate. The article’s example is
project = "IT" AND resolved >= "2025-10-01" AND resolved <= "2025-10-31" AND Satisfaction IS NOT EMPTY. - Export to CSV, using either all fields or the current fields, and check that the CSV row count matches the Issue Navigator count.
- Filter or pivot in a spreadsheet or BI tool by request type, team, time period or organization, and calculate averages, medians and distributions.
This route is a good fit when you want to audit which issues feed an average, or join CSAT with other operational fields such as SLA breaches, components or labels. Atlassian also lists alternatives, such as saving the satisfaction comment in a custom field or exporting rating and comment through the API.
The trade-off is that each new question about a segment usually means another query, export and pivot.
| Question | JQL + CSV | In-app filters |
|---|---|---|
| Where does the analysis happen? | Issue Navigator, then a spreadsheet or BI tool | The AdaptiveSurvey Dashboard |
| Best for | Auditing which issues feed an average; joining CSAT with SLA, component or label data | Checking one segment after another and reading the matching responses |
| Segment definition | Criteria written in JQL, then pivoted in the spreadsheet | Supported Jira fields available to the project, with include or exclude |
| Reading the context | Columns in a spreadsheet | Score, ticket, comment and chosen Jira fields in one list |
The in-app route: include and exclude filters on Jira fields
The filter bar sets the project, the date range and any filters. Under Add filter, Common filters cover Agent, Group, Team, Question, Score, Indicator, Comment and Lost time. Jira fields include Type, Priority, Reporter and supported custom fields available to the project.
Worked example: does communication feedback differ across offices?
Say the communication score fell last month and your team uses a Location select field.
- Choose the project and the date range for the drop.
- If your form has more than one question, add the Question filter and select Communication, so the whole Dashboard shows that question.
- Add filter → Jira fields → Location and choose London, set to include.
- Note the score and response count, then repeat for Madrid and Berlin. With the Question filter on, responses that did not answer Communication drop out of the count.
- Switch the filter to exclude, or remove it, to see the rest of the offices for comparison.
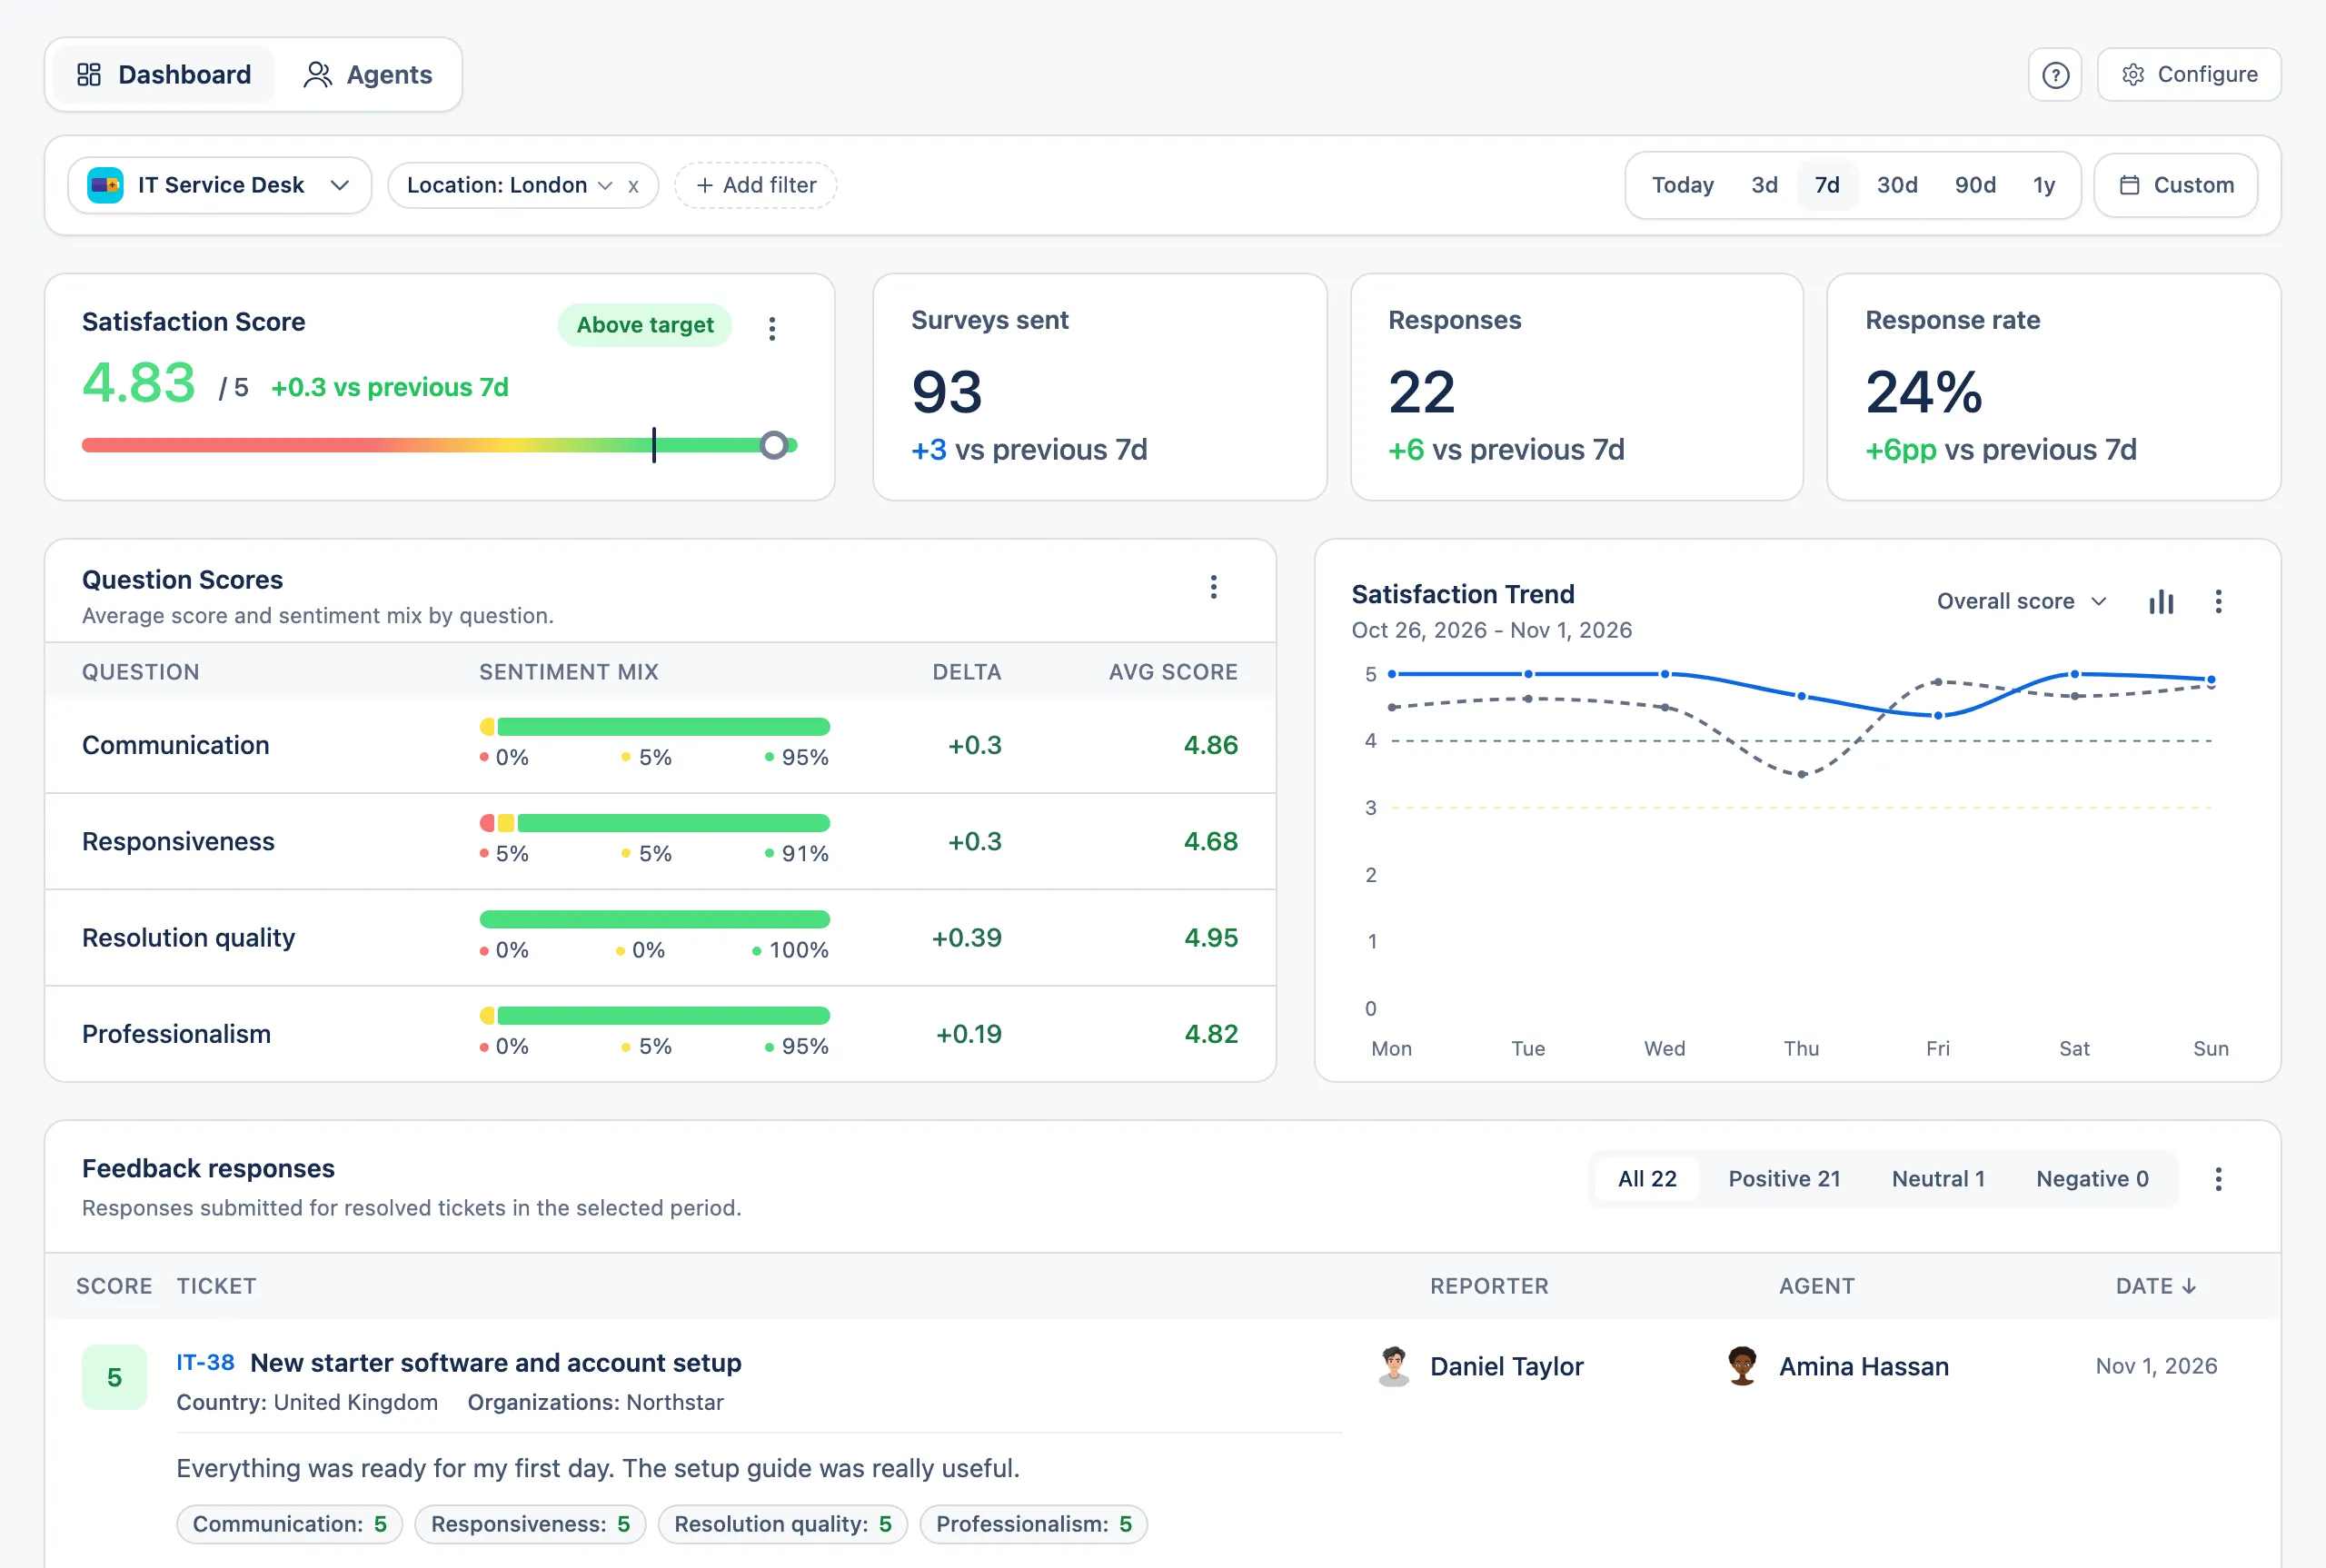
Include and exclude both work where Jira’s query operators allow them. When you exclude, empty values stay included for fields that support that kind of query. Exclude is the quickest way to compare “London versus everyone else”. There is no separate side-by-side view, so you compare by changing the filter.
What the team, group and type filters mean
- Group and Team show tickets assigned to members of the selected Jira groups or Atlassian teams. They filter by current assignee membership, so a ticket that was reassigned appears with whoever holds it now. A team view shows who holds the tickets, not who earned the score, and it does not prove cause.
- Agent shows tickets assigned to the selected Jira users.
- Type is the Jira work type, such as Service request or Incident. It is not the JSM request type.
- Reporter filters by the person who reported the ticket.
Project, date range and Jira filters, including Agent, Group and Team, apply across the Dashboard and Agents tabs and stay selected when you switch between them.
Location and Country work well when they are select fields that your team already maintains on the ticket, which makes them a good starting point for office and country comparisons.
Read comments and linked requests
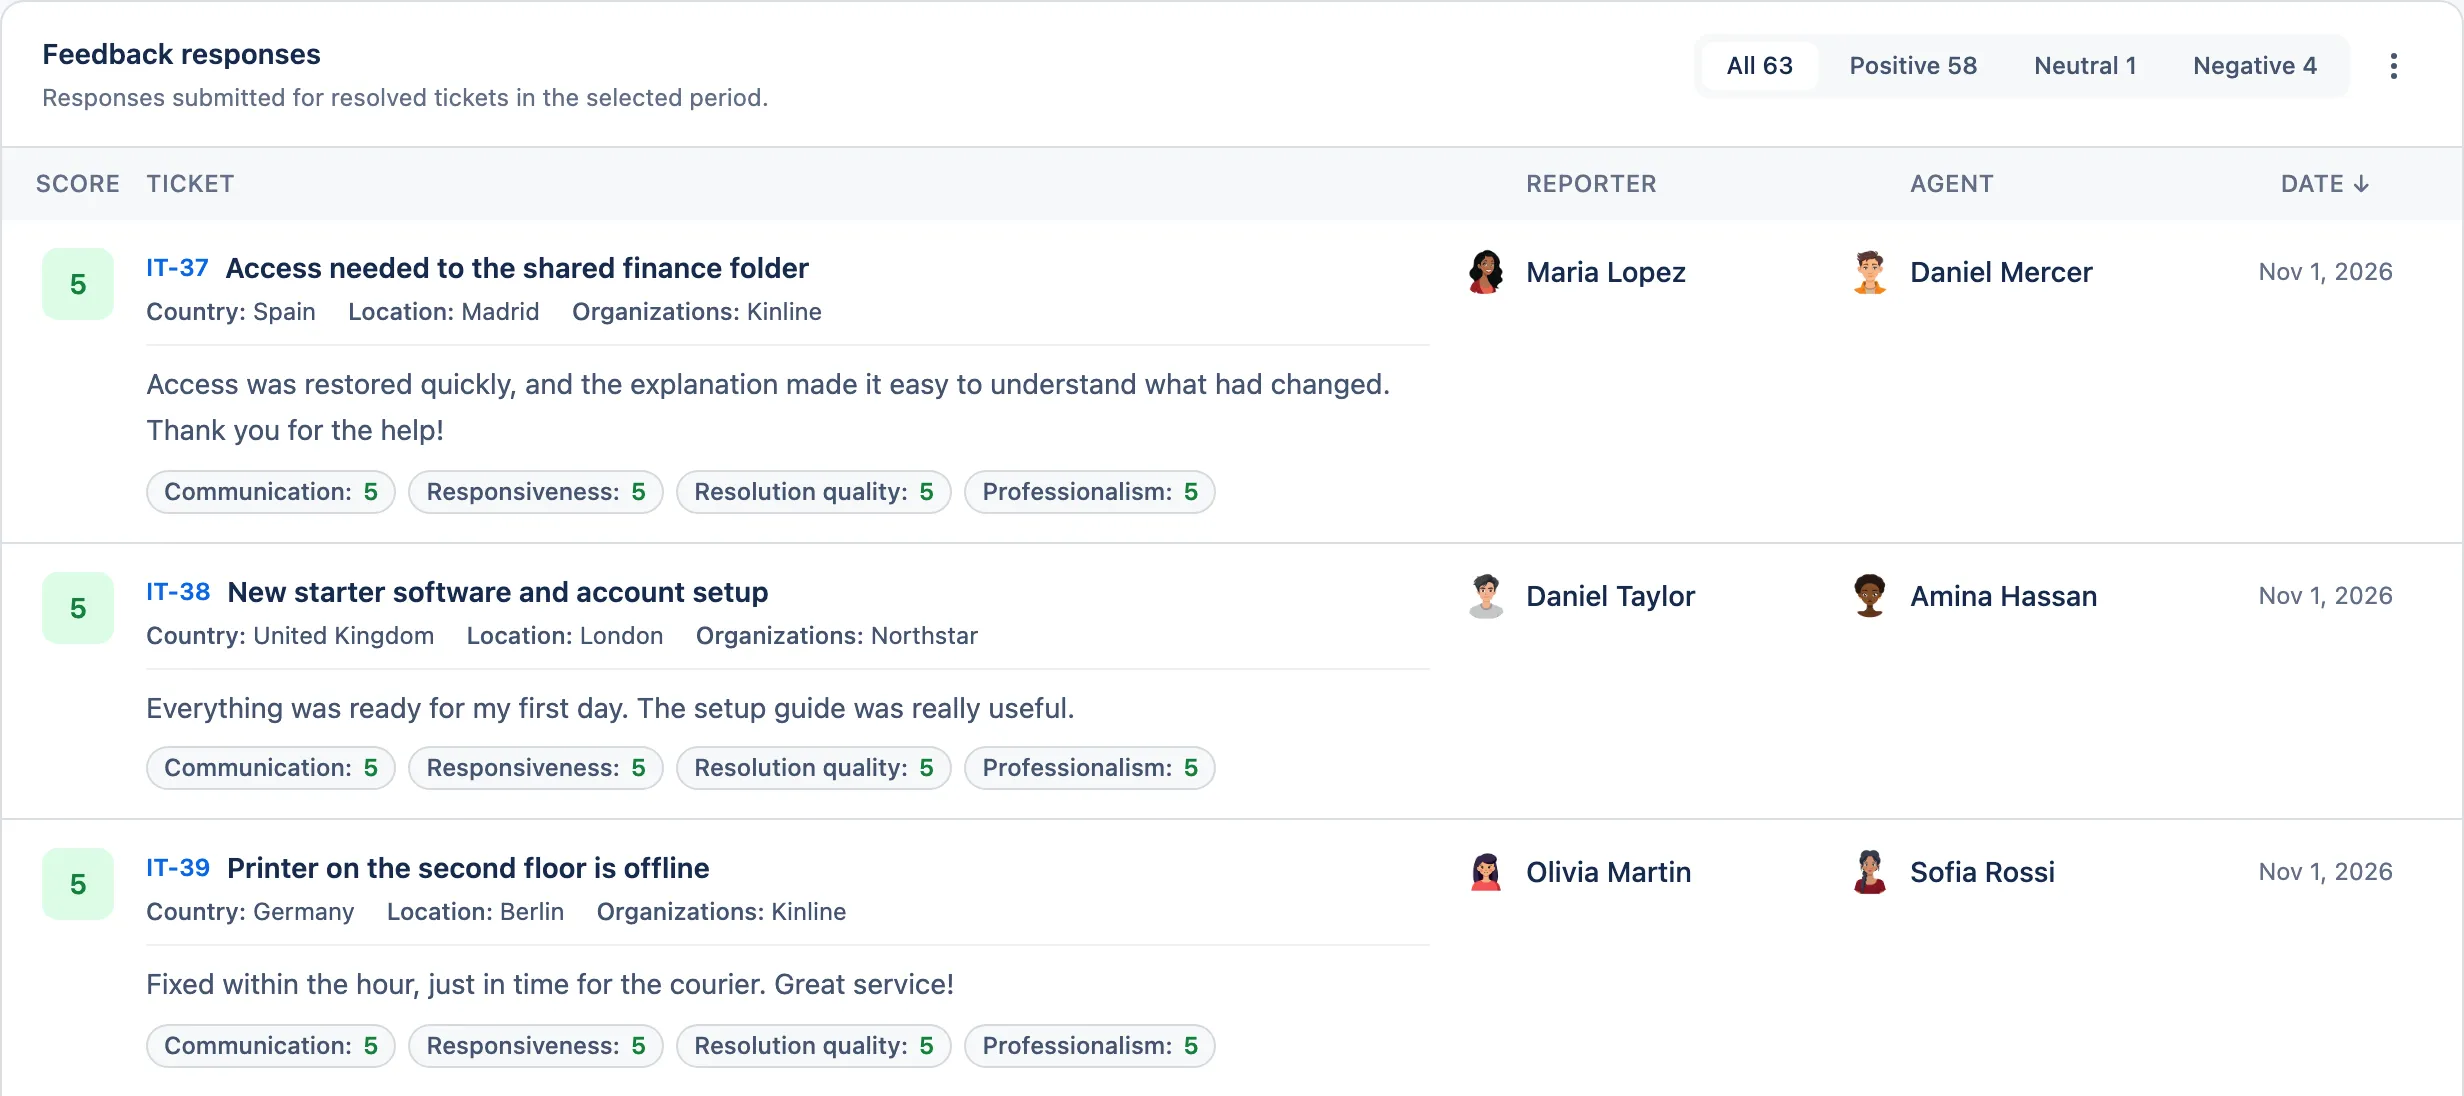
Once a segment looks different, open the individual responses. Feedback responses lists the responses behind the Dashboard numbers. Use All, Positive, Neutral or Negative to narrow the list, sort by score or date, and select a ticket key to open the linked Jira work item. Each row shows the score, ticket, date and any comment, indicators or question answers.
Display fields put more of the Jira context in the row. Open the three-dot menu on Feedback responses, choose Display fields, and add fields such as Location, Country, Organizations, Priority or Client Type. They appear below the ticket summary, so you can read a comment next to the customer and request details without opening every ticket.
A few points affect how you use this:
- Displaying a field and filtering by it are separate capabilities. Display supports more field types than filtering does. Organizations and the JSM Request type field, for example, can be displayed beside responses, but Request type is not a filter.
- Display fields are a project-wide setting. Saving a layout requires Configure access, and it applies to everyone in the project on the Dashboard and Agents response tables.
- Empty values are omitted. If you use a Client Type field with Internal and External values, your team must already maintain it on the ticket. AdaptiveSurvey does not classify customers itself.
Look for patterns across several tickets: the same request types, the same kind of complaint, the same customer organization. A pattern tells you which tickets to review with the team, but the Dashboard cannot say what caused it.
Export the matching responses
When a segment needs a service review or deeper analysis, open the three-dot menu on Feedback responses and choose Download CSV. The export contains every response that matches your current filters and response group, across all pages and in the current sort order. It includes the enabled columns, your selected Jira fields and the full feedback details. Users with View access can download it, while changing Display fields needs Configure access.
A typical use is a review for one customer segment. Filter to the segment, display Country or Organizations, export, and bring the comments to the meeting rather than only an overall score. The export is a manual download, not a live link to an analytics tool. If you need to join CSAT with SLA, component or label data, the JQL and CSV route above fits that task better.
Making a custom field filterable
If a field you want to filter by does not appear under Add filter → Jira fields, check these in order, as set out in the Custom Field Filters documentation:
- Type. Supported custom filters include selection, cascading, checkbox and user-picker fields. Text, date, number and Assets fields are not supported as filters. Using a field only for display is a different matter, as described above.
- Searchable. The field must be searchable in Jira.
- Screen. In Jira settings → Work items → Fields, open the field’s Actions menu, choose Add field to screen, and select the View/Edit screen your project’s work type uses.
- Context. Under Contexts and default values, make sure the context includes your project and the work types you want to filter. A global context is valid, but it alone does not guarantee availability.
- Field configuration. The field must be included in the project’s field configuration and not hidden.
- Reload. Reload AdaptiveSurvey after changing Jira settings.
If you are planning a segment such as Country or Location, make it a select field and confirm that it appears in Add filter before you start the investigation.
To try this on your own Jira data, you can install AdaptiveSurvey from the Atlassian Marketplace. The AdaptiveSurvey documentation covers the Dashboard and filters in more detail.